Drupal, PHPStorm, Xdebug and remote debugging over SSH

To be a really efficient developer, you have to use the best tools available. And when it comes to debugging Xdebug is certainly the best tool. If you are working on some project that is not trivial and simple, then you know that it's not always a smooth sail. You will reach a point when you need to see what is happening in your code.
Old school method for debugging is good enough if you are debugging something simple, but when it comes to the more complex parts of your code, using var_dump or Devel is not good enough. You have to call these functions from your code and then inspect what will they print out on your screen. This can be a very time consuming process.
So, to be able to really follow the execution of your code and state of variables, you need to use a proper debugger. In this blog post I will show you, how you can easily set up remote debugging for Drupal projects. You can of course apply the same technique to some other PHP framework or CMS.
1. Install Xdebug
First step is to install Xdebug PHP extension. I will show you how to install Xdebug on Ubuntu 16.04 and PHP 7. To install Xdebug execute the following command:
sudo apt-get install php-xdebug
Now you need to locate your php.ini file. You can do that by visiting the following page in your Drupal instance:
/admin/reports/status/php
Look for Loaded Configuration File value, and that is where you php.ini is located. SSH to your server and open this file:
vim /etc/php/7.0/fpm/php.ini
and add the following lines at the end of the file:
[xdebug]
xdebug.remote_enable=1
xdebug.remote_host=127.0.0.1
xdebug.remote_port=9000
Now you can restart PHP by executing:
systemctl restart php7.0-fpm
2. Install Chrome extension
To make debugging easier you need to install Xdebug helper extension for Chrome web browser. It will add a simple drop down menu. When you start to debug just click on the extension's icon and click on the Debug button.
https://chrome.google.com/webstore/detail/xdebug-helper/eadndfjplgieldjbigjakmdgkmoaaaoc?hl=en

3. SSH Tunnel
You need to set up a SSH tunnel between your local machine and the remote server. If you are using Windows then Putty is the best tool. Just add a new tunnel to your existing connection and you are good to go.
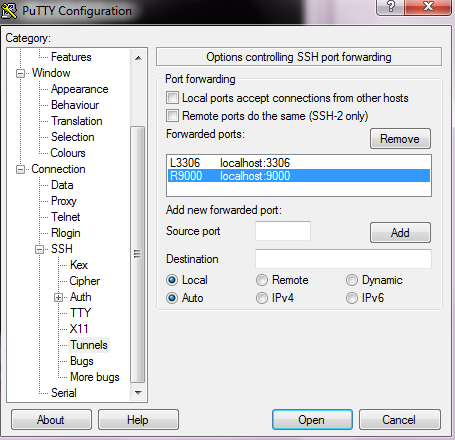
As you can see, I'm using two forwarded ports. 3306 is for MySQL and 9000 is for Xdebug. Please note that 9000 port destination is Remote, so make sure you select the correct radio button while adding port mapping.
4. File mapping
To be able to debug your Drupal project, you must have your project locally and on the remote server. Then add server configuration and mapping in PHPStorm settings, like you always do. You can find these setting in the following menu:
Tools -> Deployment -> Configuration
5. Start debugging
To efficiently debug you must change max execution time both for PHP and your server. It's probably a good idea to set these values to around 5 minutes or so. This will give you enough time to do debugging without getting a page timeout.
Start you PHPStorm and click on:
Run -> Start listening for PHP Debugging Connections
and add a breakpoint in your code.
Start your SSH session with Putty, click on the Debug button in Chrome's extension and reload page you are debugging. PHPStorm will start flashing and that means that your code reached a breakpoint and you can start debugging. Then you can use standard debugging actions like step over, step into and step out to follow the execution of your code.
Using Devel module is fine for small projects, but to be really efficient you must use a proper tool. PHPStorm and Xdebug is a perfect combination, and I highly recommend you to try it. You will never use Devel or var_dump again.